Getting Started
This guide will help you install and use DEGIRO Portfolio Tracker in just a few minutes.
Installation
Step 1: Install Python
You need Python 3.11 or newer. Download Python here if you don’t have it.
To check if you have Python installed, open Terminal (Mac/Linux) or Command Prompt (Windows) and type:
python --version
Step 2: Install the Application
Open Terminal (Mac/Linux) or Command Prompt (Windows) and run:
pip install degiro_portfolio
This installs the application including desktop mode support.
Note for Developers: If you want to install from source code, see the Developer Appendix.
Quick Start
1. Launch the Desktop App
python -m degiro_portfolio --desktop
The application opens in a native window — no browser needed. The server starts and stops automatically with the window.
On Mac, the window uses WebKit; on Windows, it uses WebView2. Everything runs locally on your computer.
To use a different port (e.g., if 8000 is busy):
python -m degiro_portfolio --desktop --port 8001
2. Open the Dashboard
If running in web mode, open your web browser (Chrome, Firefox, Safari, etc.) and go to:
http://localhost:8000
You should now see the portfolio dashboard!
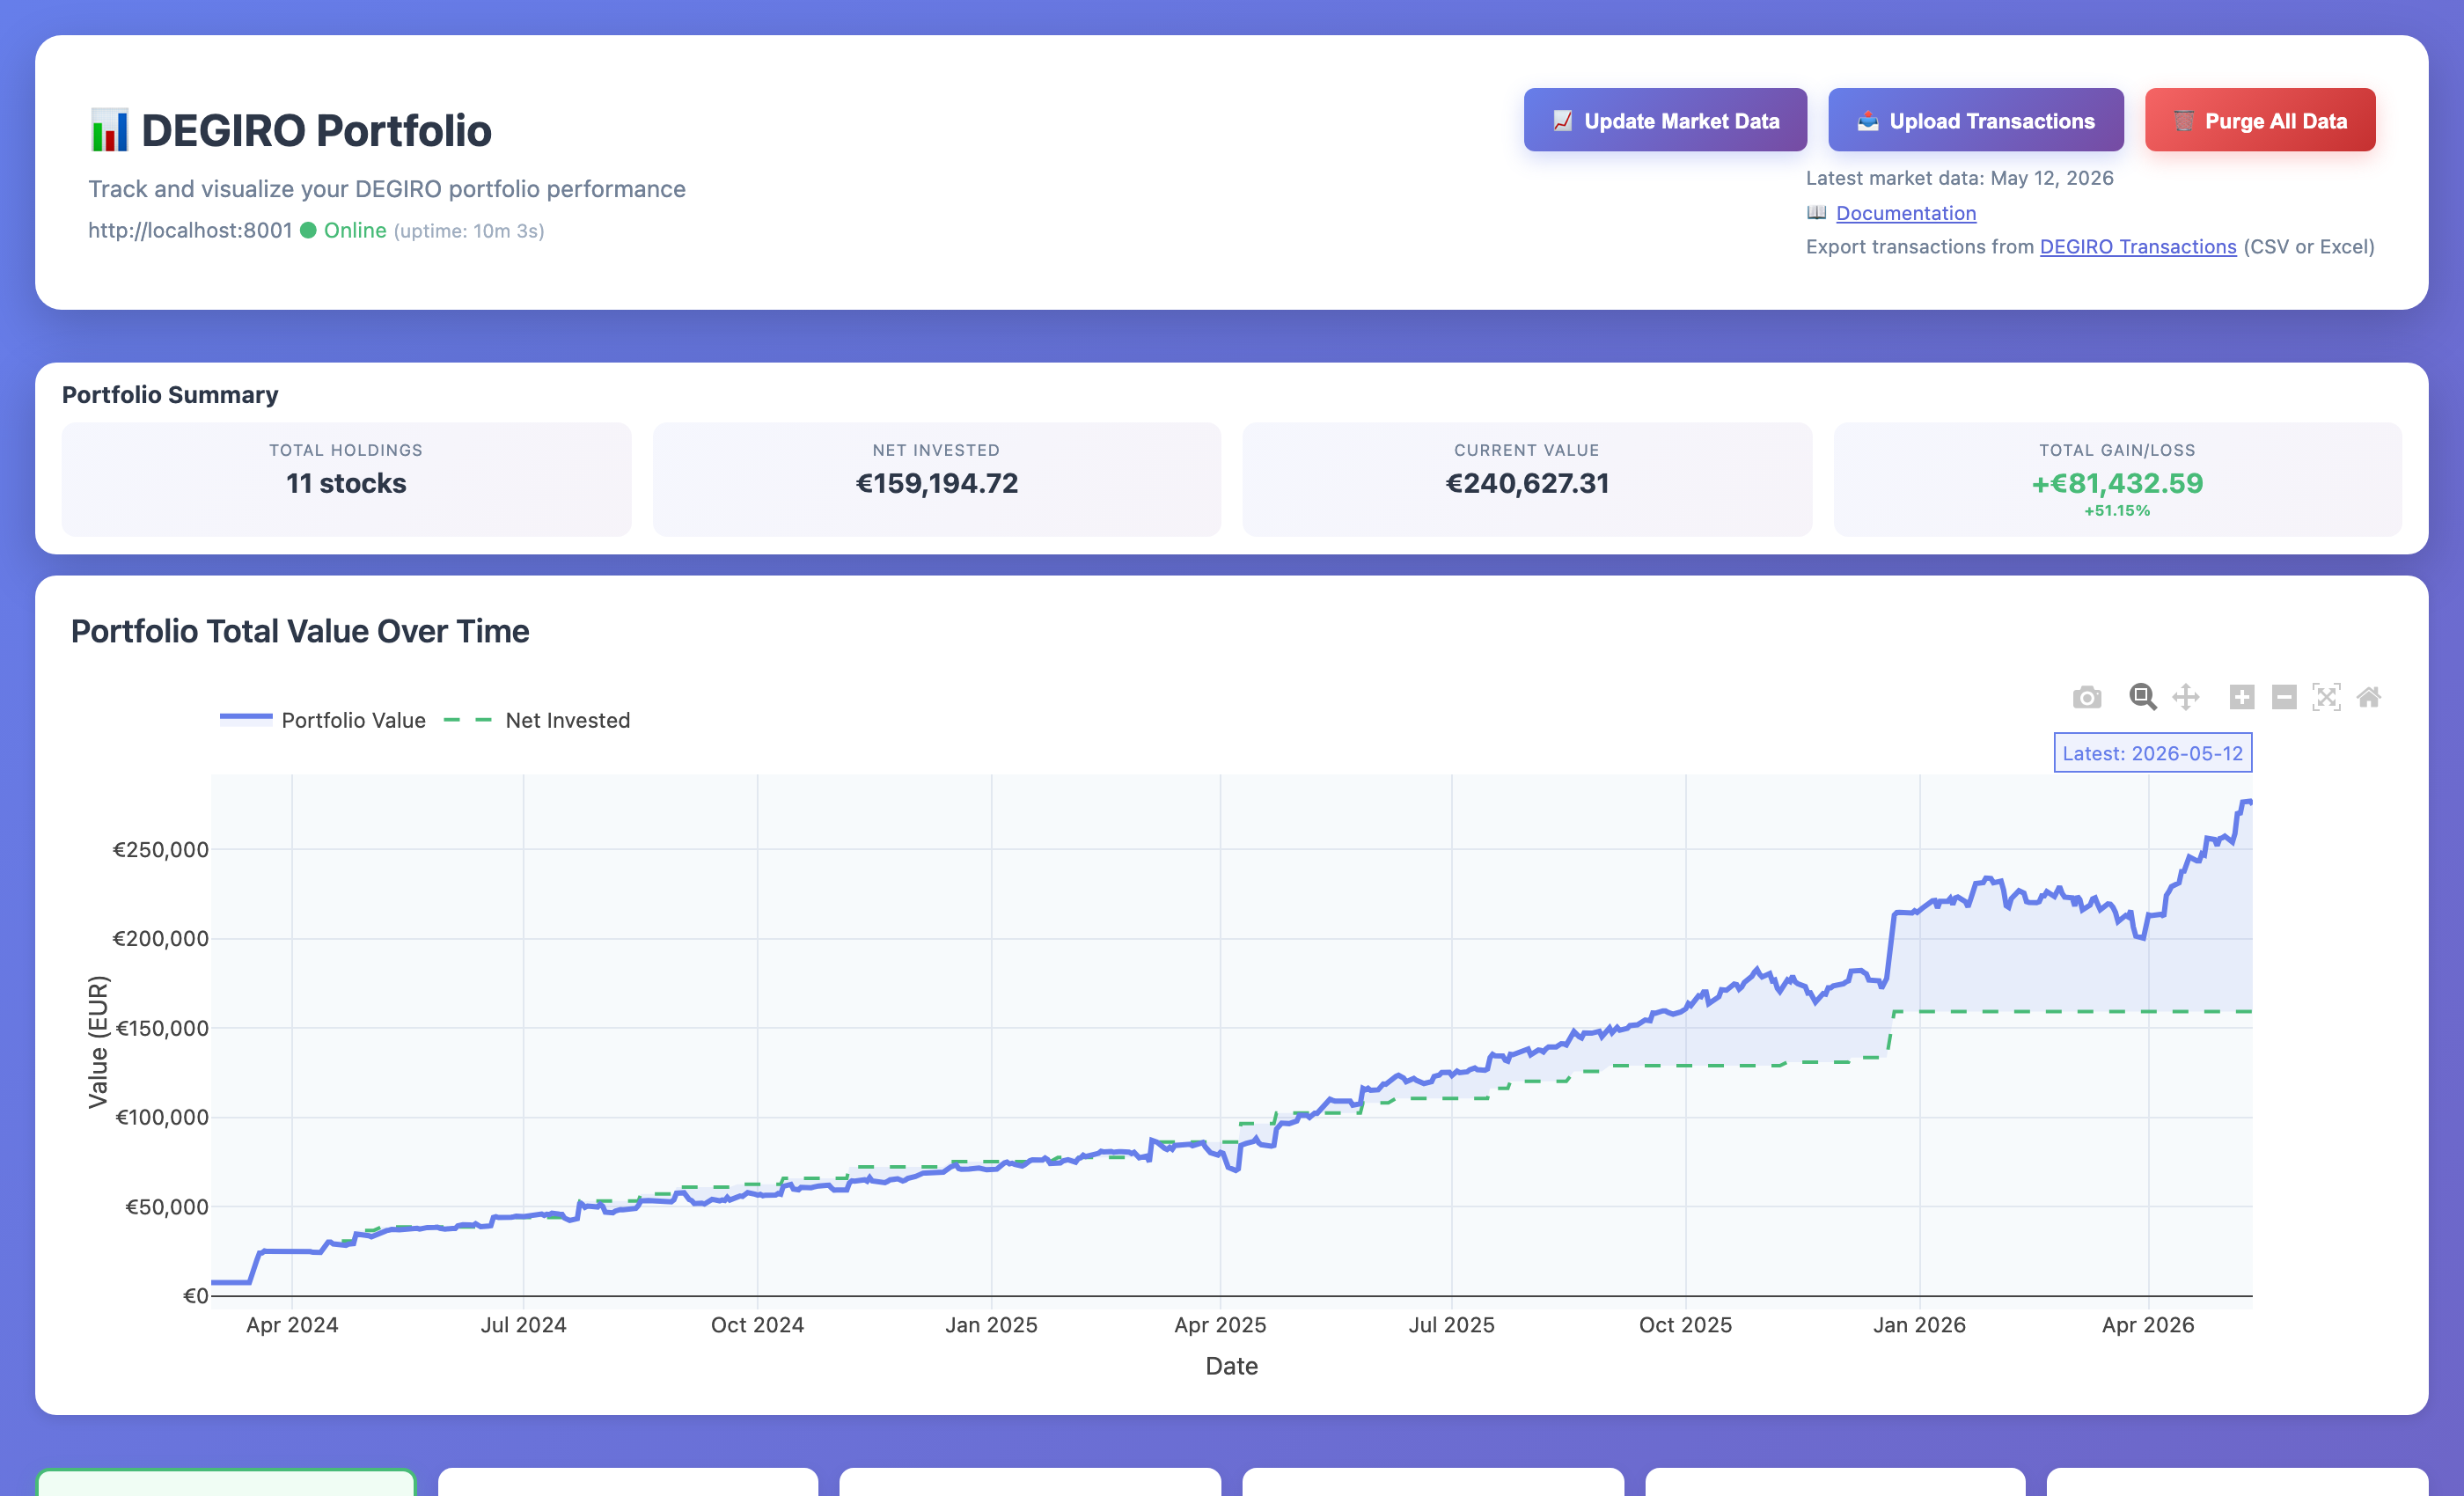 The main portfolio dashboard showing your holdings, performance charts, and action buttons
What’s localhost? It’s a special address that means “this computer”. The dashboard only runs on your computer and can’t be accessed from anywhere else.
3. Upload Your First Transaction File
The main dashboard with the Upload Transactions button in the top-right
Step 1: Export from DEGIRO
Log in to your DEGIRO account at trader.degiro.nl
Navigate to Transactions (or go directly to
https://trader.degiro.nl/trader/#/transactions)Set your date range (e.g., “All time” or specific period)
Click Export and choose CSV or Excel format
Save the file (typically named
Transactions.csvorTransactions.xlsx)
Step 2: Upload to the Application
Click the 📤 Upload Transactions button in the top-right corner of the application
Select your DEGIRO transactions file (
.csvor.xlsx)Click Upload
The application will automatically:
Import all transactions
Fetch historical price data for your stocks
Update live market prices
Fetch market index data (S&P 500, Euro Stoxx 50) for comparison
That’s it! Your portfolio is now ready to view with:
Interactive price charts
Transaction history
Performance metrics
Market index comparisons
4. Refresh Stock Prices (Optional)
Stock prices are automatically downloaded when you upload transactions. To get the latest prices at any time:
Click the 📈 Update Market Data button at the top of the page
Wait a moment while prices update (you’ll see a loading indicator)
The charts and stock cards will refresh with the latest data
How often should I update? Stock markets only change during trading hours (weekdays), so updating once per day is usually sufficient.
What You’ll See First
When you first open the application (before uploading any data), you’ll see an empty dashboard with the three action buttons at the top. This is normal!
To get started, click the “📤 Upload Transactions” button and select your DEGIRO Excel export file.
After uploading, the application will:
Import all your transactions (takes a few seconds)
Download historical prices for all your stocks (takes 1-2 minutes)
Fetch market index data for comparison (S&P 500, Euro Stoxx 50)
Display your complete portfolio with charts
Be patient on first upload! The first import takes longer because it downloads all historical price data. Subsequent uploads are much faster.
Understanding Your Dashboard
After uploading transactions, you’ll see:
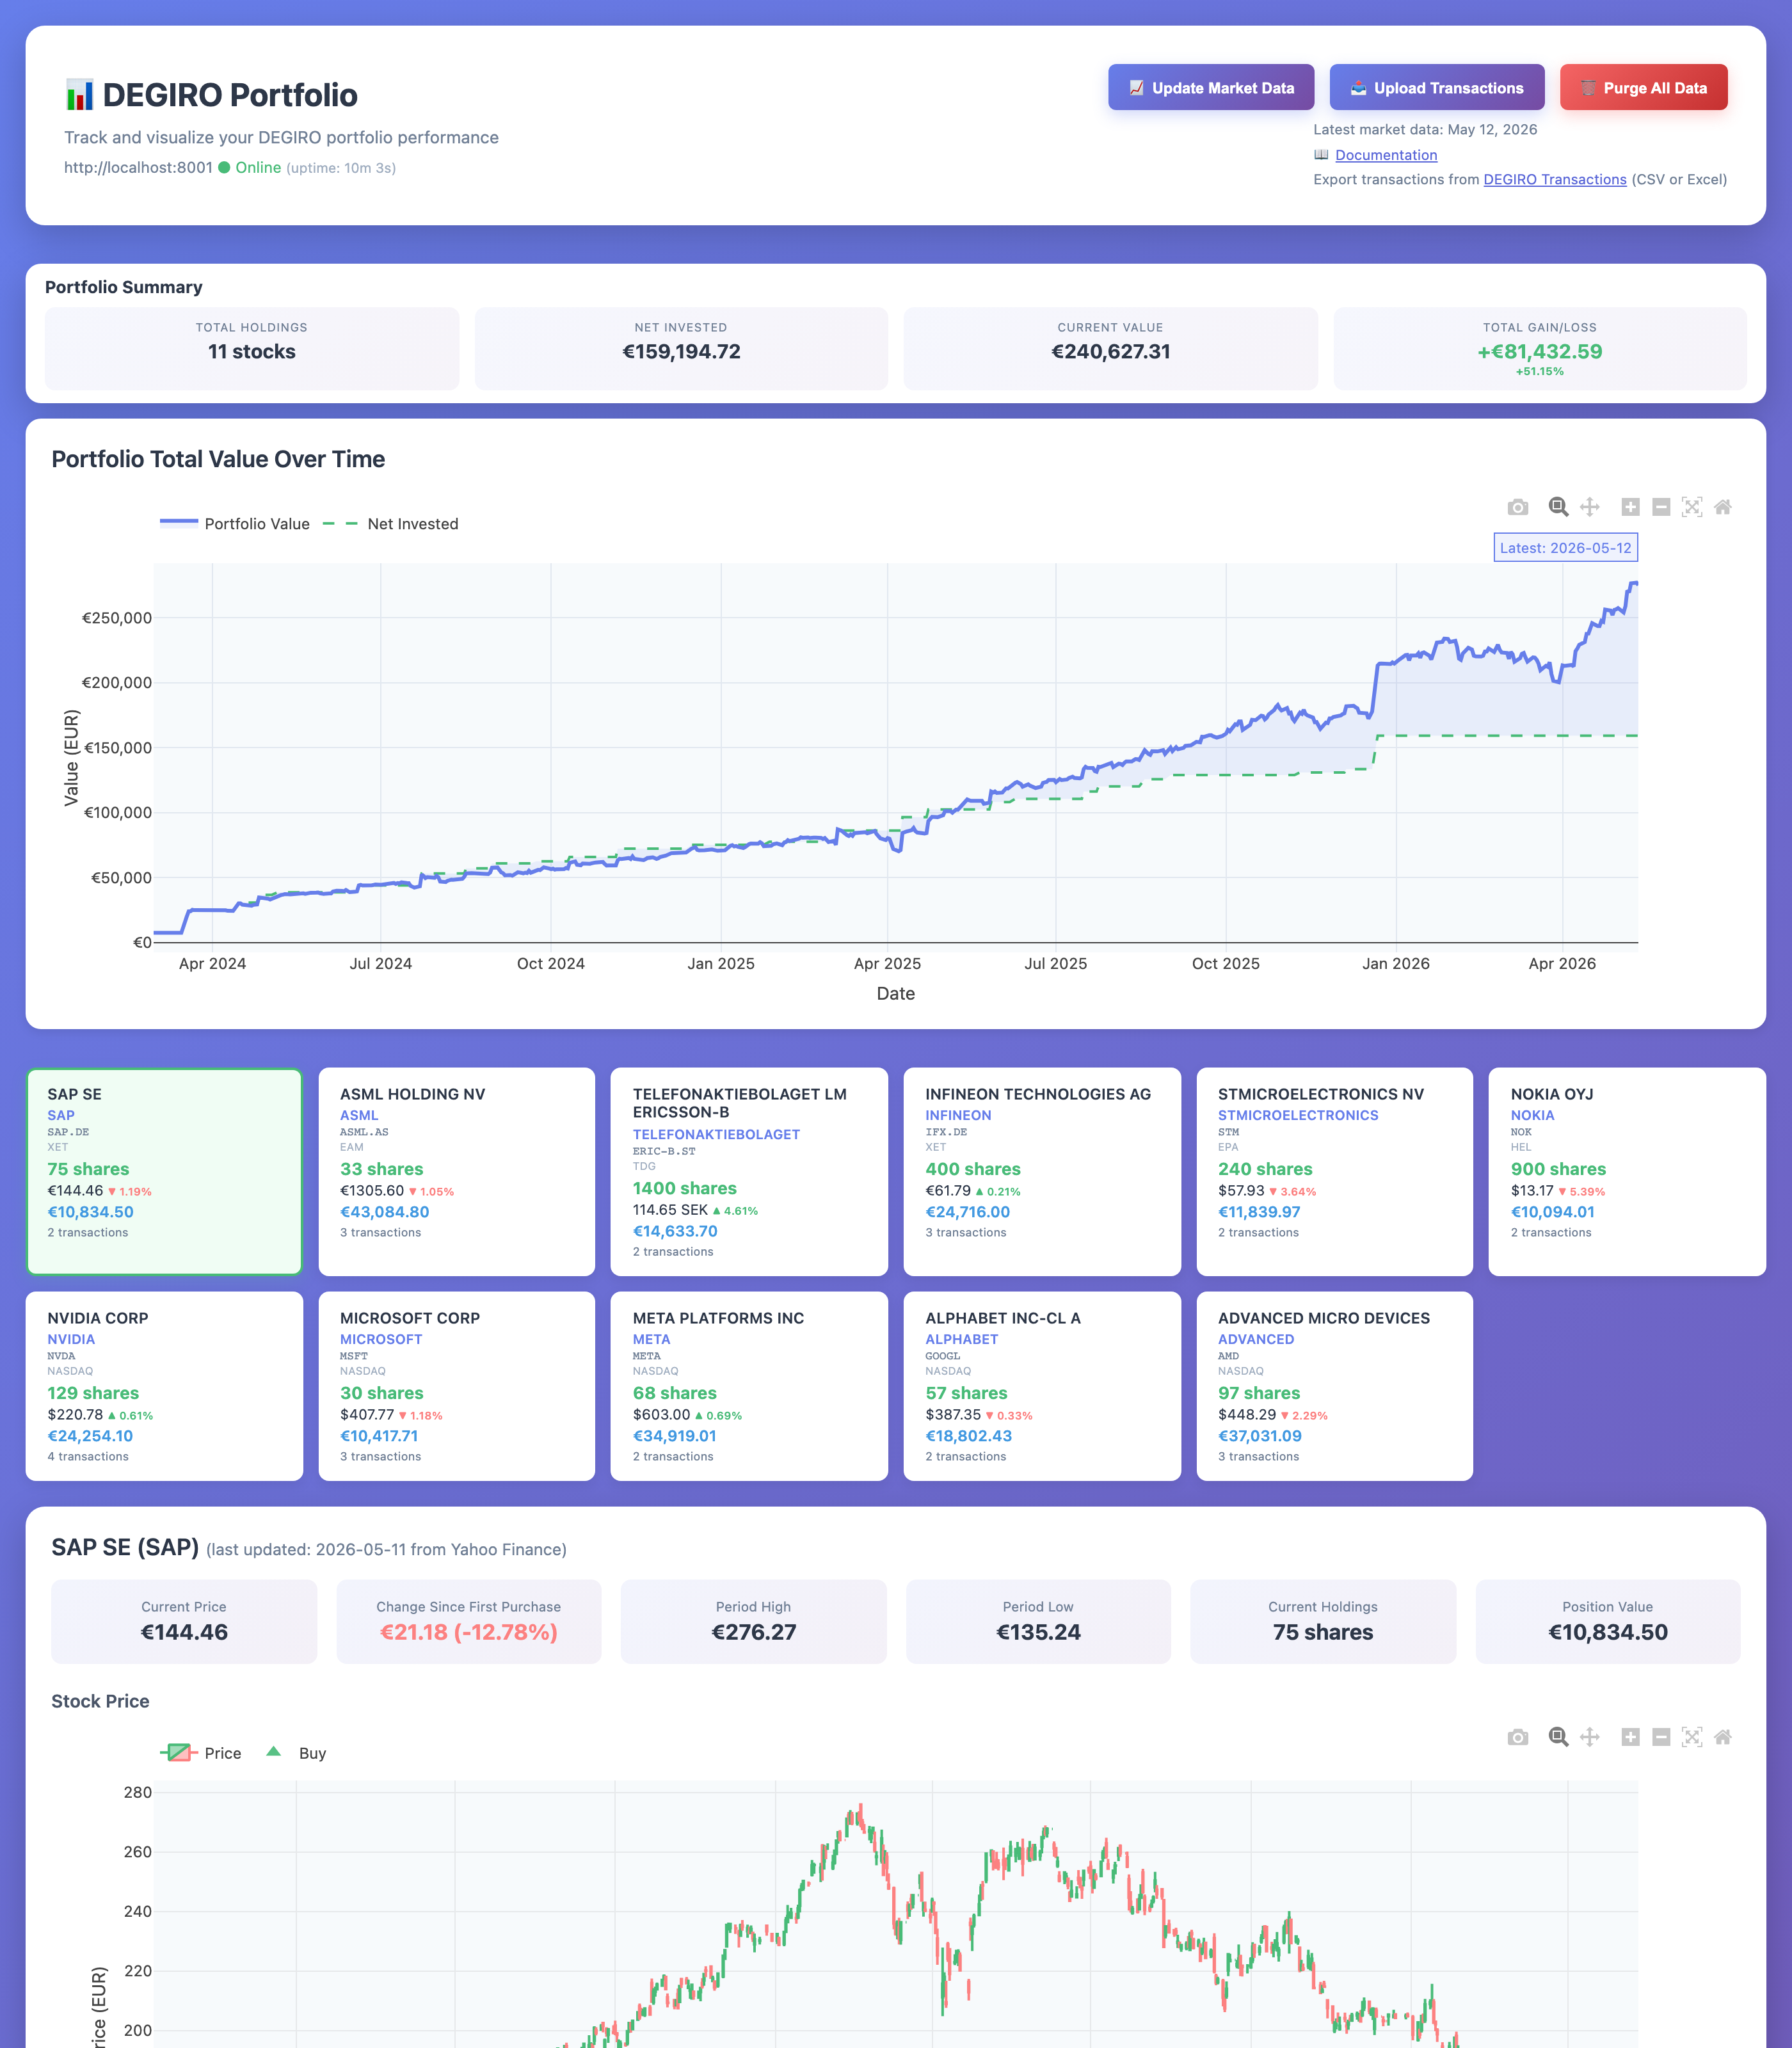 Complete portfolio view showing summary, stock cards, and detailed charts
Portfolio Summary
Shows your total portfolio value and overall gain/loss percentage.
Stock Cards
Each card shows:
Company name (click to search for investor info)
Number of shares you own
Current price with today’s change (▲ up / ▼ down)
Total value of your position in EUR
Ticker symbol (click to view on Google Finance)
Exchange where it trades
Charts
Click any stock card to see:
Price Chart - Historical prices with your buy/sell transactions marked
Position Value % - Shows if you’re profitable (above 100% = profit)
Investment Tranches - Performance of each individual purchase
Market Comparison - How your stock compares to S&P 500 and Euro Stoxx 50
What File Formats Are Supported?
The application works with DEGIRO’s transaction export in both CSV and Excel formats:
CSV (
.csv) — The standard export from trader.degiro.nl/trader/#/transactions. This is the 18-column format with all transaction details.Excel (
.xlsx,.xls) — Also exported from DEGIRO. Both 14-column and 18-column layouts are supported.
Both formats are auto-detected — just export from DEGIRO and upload. The app handles column mapping automatically, regardless of your DEGIRO language setting (English, Dutch, German, etc.).
Don’t worry about the format — if you export from DEGIRO’s Transactions page, the format will be correct automatically.
Stock Prices
The application uses Yahoo Finance for stock prices — it’s free and requires no configuration. See Data Providers for more details.
Alternative: Web Server Mode
If you prefer to use a browser instead of the desktop app, run without --desktop:
python -m degiro_portfolio
Then open http://localhost:8000 in your browser.
Mac/Linux also supports the CLI for background server management:
degiro_portfolio start     # Start the server
degiro_portfolio stop      # Stop the server
degiro_portfolio restart   # Restart the server
degiro_portfolio status    # Check if server is running
Windows: Use python -m degiro_portfolio for all commands.
Next Steps
Features - Explore all available features
Data Providers - Learn about price data sources
Advanced Setup - Advanced configuration options
Troubleshooting
The application won’t start
Problem: Running degiro_portfolio start gives an error.
Solutions:
Make sure Python 3.11+ is installed: Run
python --versionto checkTry:
python -m degiro_portfolio startinsteadCheck if port 8000 is already in use by another program
Restart your computer and try again
Can’t open the dashboard in my browser
Problem: Browser shows “This site can’t be reached” or “Connection refused”.
Solutions:
Make sure the server is running: Run
degiro_portfolio statusTry the URL exactly:
http://localhost:8000(not https://)Try
http://127.0.0.1:8000insteadCheck if your firewall is blocking port 8000
My stocks don’t show any prices
Problem: Stock cards show no prices or values.
Solutions:
Wait a few moments - prices download in the background after upload
Click the “📈 Update Market Data” button
Check your internet connection
Some stocks might not be available on Yahoo Finance (rare for major stocks)
Check the browser console for error messages (press F12)
A specific stock can’t be found
Problem: One or more stocks show “Price data unavailable”.
Solutions:
Check the stock’s ISIN in your DEGIRO export is correct
Try updating market data again
The stock might be delisted or only available on regional exchanges
Consider configuring a different data provider (see Advanced section)
The page loads but looks broken
Problem: Layout is weird, buttons missing, or page doesn’t display correctly.
Solutions:
Refresh the page (Ctrl+R or Cmd+R)
Clear your browser cache
Try a different browser (Chrome, Firefox, Safari)
Make sure JavaScript is enabled in your browser
Charts don’t appear
Problem: Stock cards show but clicking them doesn’t show charts.
Solutions:
Check browser console for JavaScript errors (press F12)
Make sure you have price data (see “stocks don’t show prices” above)
Try refreshing the page
Disable browser extensions that might block content
Server keeps stopping or crashing
Problem: Server stops running after a while.
Solutions:
Check the logs:
degiro_portfolio logs(or check server.log file)Make sure you have enough disk space
Check if your computer goes to sleep - keep it awake
Run in a terminal that stays open (don’t close the terminal window)
Need More Help?
If you’re still stuck:
Check the logs for error messages:
degiro_portfolio logsVisit the GitHub Issues page to report the problem
Include these details when asking for help:
What you were trying to do
What happened instead
Any error messages you saw (from the logs or browser console)
Your operating system (Windows/Mac/Linux)
Python version (
python --version)